
PROPESTI

Housing Costs in America : How Much Income goes Towards housing in 2026

A state-by-state look at housing affordability, income pressure, and the growing cost of living across the United States.

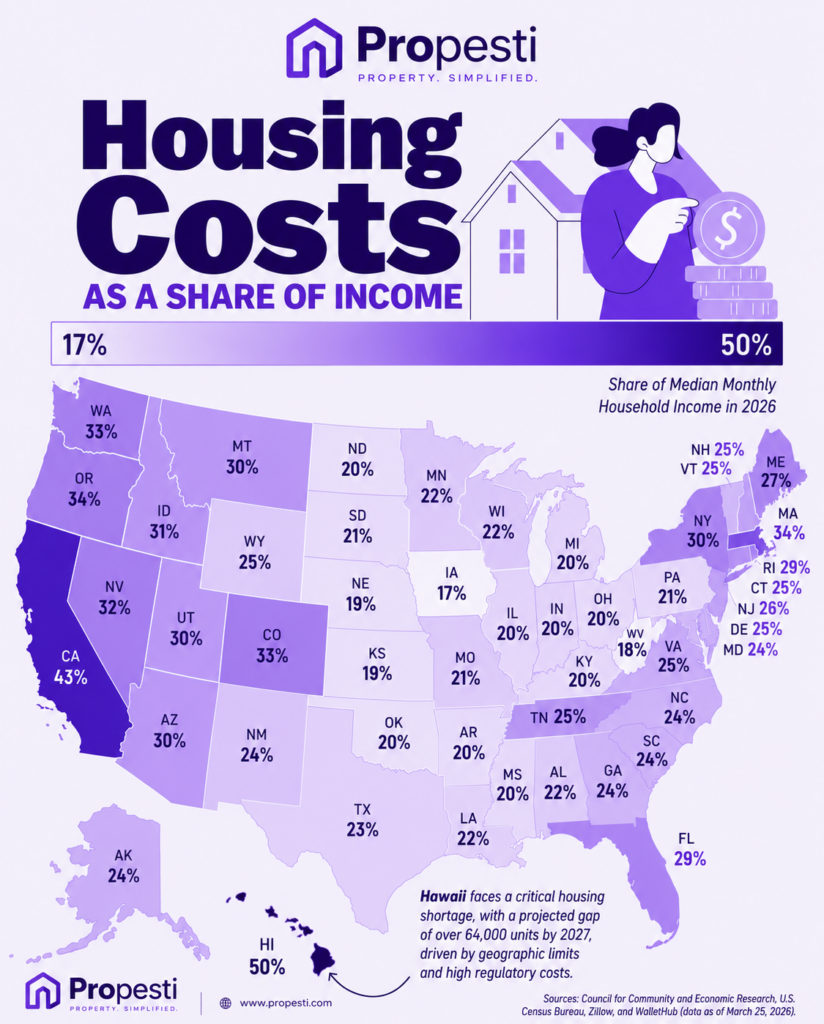
Map showing housing costs as a percentage of median household income across U.S. states in 2026

Housing affordability continues to shape the lives of millions of Americans in 2026. In many states, a large portion of household income now goes directly toward housing expenses, leaving families with less financial flexibility for savings, investments, and everyday living.This visual breakdown highlights how much of the median monthly household income is spent on housing across all 50 states. While some regions remain relatively affordable, others continue to experience rising pressure from home prices, rent increases, insurance costs, taxes, and limited inventory.At Propesti, our goal is to simplify complex real estate data through clear visuals, calculators, and market insights that help buyers, sellers, and investors make more informed decisions.

How Propesti Helps Simplify Housing decisions

Propesti Real estate tools platform

As housing costs continue rising across the United States, many buyers and sellers are looking for clearer ways to understand affordability, monthly costs, estimated proceeds, and investment potential before making major financial decisions.

That is why Propesti was built around simple real estate calculators designed to help users better visualize their numbers without unnecessary complexity. Instead of relying on guesswork alone, users can explore tools that estimate:

Whether someone is preparing to buy, sell, or invest, having access to clearer financial insights can make real estate decisions feel more understandable and less overwhelming.

Scroll to Top